Notes on development
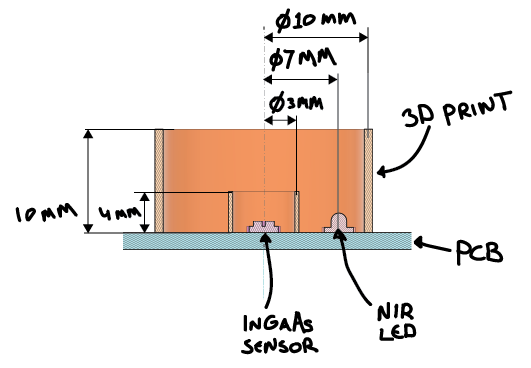
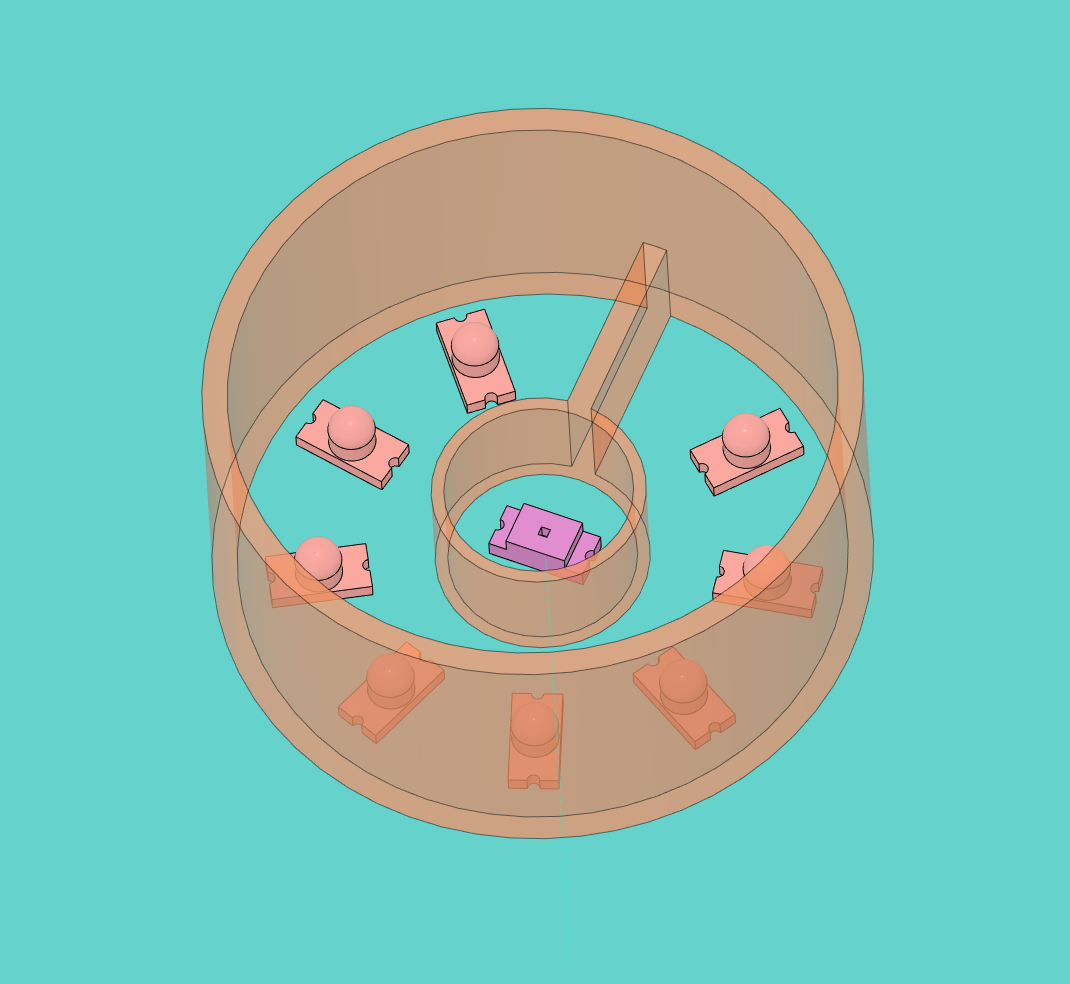
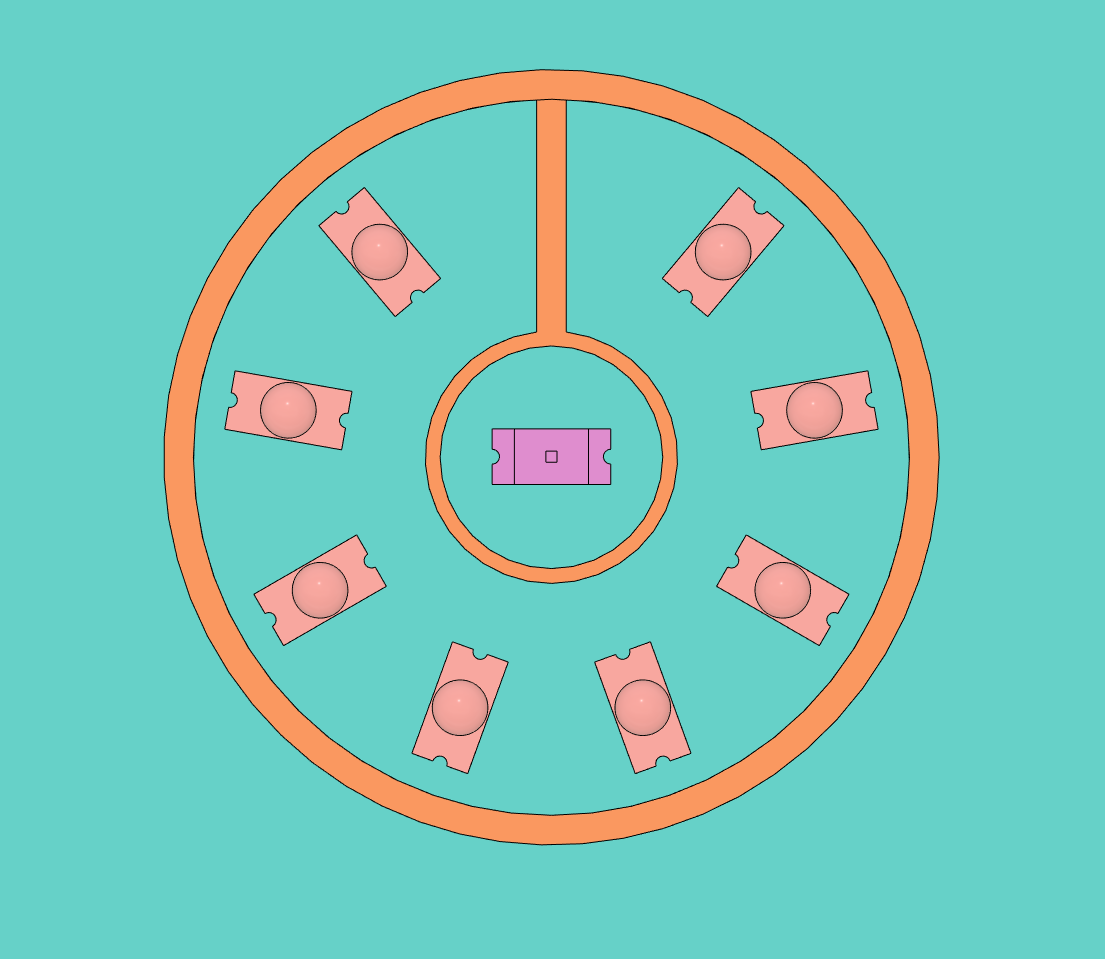
Optics setup
Measuring cavity
Question: what is the most optimal shape
- layout leds
- placement InGaAs sensor
- heigth wall between ingaas sensor and led?
- deviders between each led?
- height side of the wall?
- aluminuim tape on the sides?
- distance between sample and sensor
Question: which LEDs are the most valuable?
Backing material
Question: What is the best Backing material? ideal: a material with a flat response between the 800nm and the 1800nm
- Spectralon (but expensive)
- Polished aluminium
- White ceramic tile? (used on the Niro Gun)
Electronics circuit
Question: what is the best way so measure the signal from the InGaAs sensor Is this with a transimpeadance amplifier, which one, how stable should the reference voltage be?
investigate the use of the transimpeadance amplifier simulate the expected outcome of the current setup and make adjustments for tweaks setup of the adc with the ideal settings for our usecase
PCB
Question: What footprint of components should be used? For example SMD size.
Find a balence between batch manufacturing and single unit replication.
Question: All in one PCB or modular with separate processor and charge IC?
Question: Which components are difficult to source, why and how can we be resilliant?
Data processing
Pre-processing
The data from the board is just a number, it is the ADC value, which on itself is dimentionless. it is possible to convert this into volts, but it does not help much here. To get data ready for interpretation (between multiple plastic scanners) it is good to do the following:
- Devide by expected maximum value.
Devide measurement with calibration of polished aluminium, this gives you a percentage between 0 and 100 - Devide measurements by eachother (beerslaw)
to see if ratio is positive or negative - Scale alle ratios from 0 to 1 for input into ML model.
General idea to get from InGaAs sensor to determined plastic type
-
Take a pre measurement (with sample placed but no LED on)
-
Take a set of measurements (turn on one LED, wait 5ms, measure,turn off the LED, repeat for the rest)
-
Take a post measurement (with sample placed but no LED on)
-
Repeat steps 1-3 multiple times, this allows you to take out backgorund noise/light, if the measurements are too different it might be that the sample moved.
-
The measurements can then be compensated for the output power of the LEDs
-
The measurements can then be compensated for the sensitivity of the InGaAs photodiode
-
The measurements can be scaled relative to maximum possible measurement (a full reflection of IR light (polished aluminium))
-
At this point you want to shift the focus on the slopes of the curves, in stead of the actual values, the type of the plastic determines the shape of the curve, not the actual value
-
Normalize the slopes between 0 and 1
-
Use as input for a machine learning model
interpretation
Question: What is the current quality of the data coming out of the Plastic Scanner, and how can we improve this
Question: How can we write an identification model?
Question: Which LEDs are critical, which are nice to have, which are redundant?
Housing
this is more long term, but find out most common working conditions for a plastic scanner and define it's harsness